ABCDou Insights
Exploring the world of news, trends, and information.
Data Deluge: Surfing the Waves of Big Data Analytics
Ride the tide of big data analytics! Discover strategies to navigate the data deluge and unlock hidden insights for your business success.
Understanding Big Data: Key Concepts and Terminology
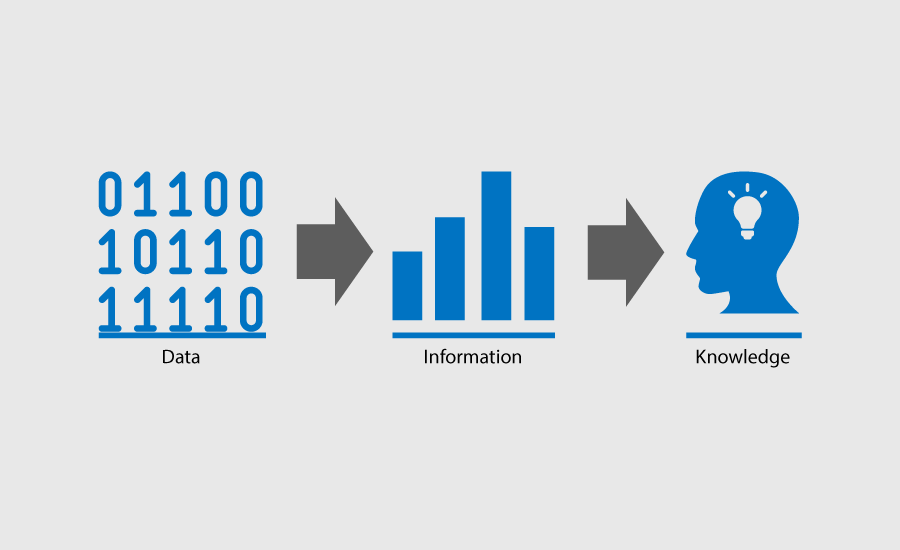
Big Data refers to the vast volume of structured and unstructured data that inundates businesses on a day-to-day basis. The challenge lies not in the amount of data, but in the ability to process and analyze it effectively. Key concepts surrounding Big Data include the three Vs — Volume, Variety, and Velocity. Volume refers to the sheer amount of data, Variety indicates the different types of data (structured, semi-structured, unstructured), and Velocity pertains to the speed at which data is generated and processed. Understanding these concepts is crucial for anyone looking to leverage Big Data for business intelligence.
Another important element of Big Data is its related terminology, which includes data analytics, machine learning, and cloud computing. Data analytics is the science of analyzing raw data to make conclusions about that information, while machine learning applies these findings using algorithms to improve performance on specific tasks. Additionally, cloud computing provides the infrastructure and resources necessary to store and analyze large datasets efficiently. For further insights into these topics, you can check out this resource that delves deeper into the world of Big Data.

Top Tools and Technologies to Navigate Big Data Analytics
As organizations strive to harness the power of big data analytics, choosing the right tools and technologies becomes paramount. Among the top tools, SAS stands out with its comprehensive analytics capabilities, suited for both small and large enterprises. Apache Hadoop, an open-source framework, is another essential technology that enables the distributed processing of vast data sets across clusters of computers. Its ecosystem, including tools like Apache Spark, allows for real-time data processing and complex analytics, making it a favorite for many data professionals.
In addition to these frameworks, several other technologies enhance big data analytics. For example, Tableau is a powerful visualization tool that helps data teams create interactive visuals and dashboards, streamlining decision-making processes. On the cloud front, services like AWS Big Data Services provide scalable storage and analytics solutions, giving businesses the flexibility to handle fluctuating data volumes. Together, these tools form a robust toolkit for navigating the ever-evolving landscape of big data analytics.
How to Effectively Manage and Analyze Large Data Sets: Tips and Best Practices
Managing and analyzing large data sets can be a daunting task, but with the right tips and best practices, it becomes manageable. First, it is crucial to utilize robust data management tools that can handle the size and complexity of your data. Software solutions like Tableau and Microsoft Excel offer advanced analytical features that help in visualizing data effectively. Additionally, consider implementing data cleaning processes to ensure accuracy and consistency. A clean dataset is foundational for reliable analysis, and utilizing libraries such as Pandas in Python can greatly assist in this step.
Once your data is well-organized, focus on analysis techniques that can uncover valuable insights. Using machine learning algorithms can automate the analysis process, providing deeper insights into trends and patterns. Resources like Kaggle offer datasets and competitions that can enhance your analytical skills. Additionally, adopting data visualization techniques is essential to communicate insights effectively. Tools like Google Charts and Chart.js make it easier to create interactive visuals. By combining powerful tools and techniques, you can manage and analyze large data sets with greater efficiency and accuracy.